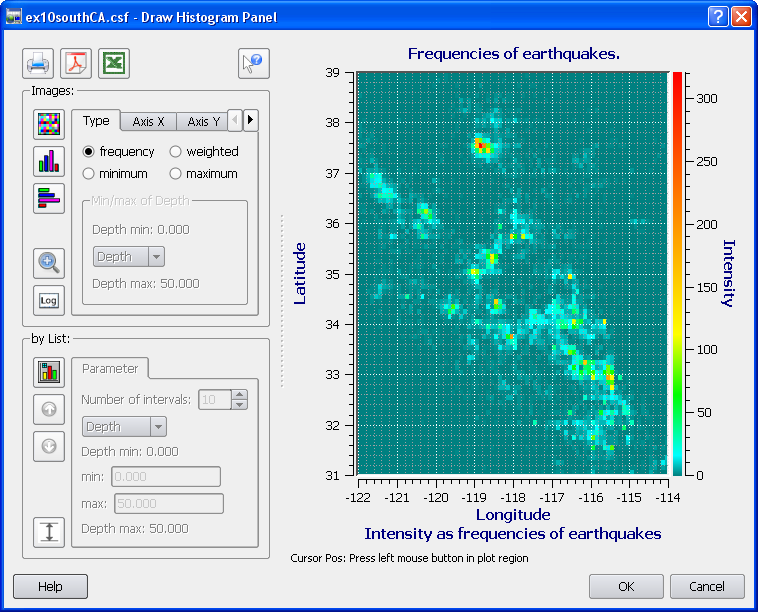
The 2-D histogram displays frequencies as color coded
cells, which size could be adjusted by changing the
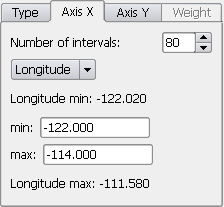
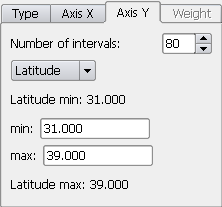
Number of intervals
(from 10 to 150) and the
min and
max limits attributed
to X and Y axes. The associated colors of
Intensity scale
are shown on the right side of the histogram. The user may change
the X and Y axes to time (in years), latitude, longitude, depth, and
any of the four magnitudes. To confirm the choice and redraw 2-D
histogram, click button

..
The button

allows the user to zoom on an area of interest in a 2-D histogram.
Toggle the button, bring the cursor on the histogram plate, outline
the area of interest by pressing the left mouse button and dragging
the cursor. (With the left mouse button pressed at any place of the
histogram plate the program displays the cursor XY coordinates. Clicking
the right mouse button will zoom out the display one step back . Zooming
can operated as often as possible.)
The button

allows the user to switch
Intensity scale from linear
to logarithmic one. To switch scales toggle the button and redraw
histogram.
To display a traditional 1-D histogram either for X- or Y-axis click
either button

or

, respectively. Traditional histograms displays frequencies
as bars of different heights.
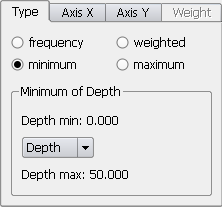
The user may wish mapping catalog characteristics that differ from the
default frequencies. Specifically, there are four optional choices of
the histogram Type - frequency, weighted, minimum, maximum.
The default type frequency denotes as Intensity the number of
events inside a cell on the map. When minimum (or maximum)
type is invoked the lower frame of the tab becomes active permitting the
user to make a choice from Depth and magnitudes (m1, m2, m3, m4),
which minimum (or maximum) in each cell will be mapped.
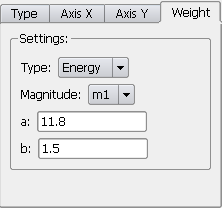
When weighted type is invoked the tab Weight
becomes active. In this case CompiCat provides making a choice between sums
of earthquake energy, area, and length, as well as the user defined
10a*m+b weights (where a and b are arbitrary
constants, and m is the earthquake magnitude). These quantities permit
better understanding the distribution of the energy release, or the area
ruptured, or the total length of ruptures in the area of interest. Open Weight
tab to define the choice and specify weights, which will be used for
calculation and mapping of weighted sum in each cell.
To produce series of histograms toggle
Invoke
by List button

. Make the choice of an additional parameter,
Number of
intervals (from 2 to 20), and the
min and
max limits
to be used. Toggle button
Switch image scale 
to specify either a common or interval dependent normalized
scales of intensity. Click either of
Redraw buttons to display
a series of 1-D or 2-D histograms. Click

or

button to display the previous or the next histogram
in a series.
If needed, invoke help text on buttons by clicking

, then click a button to get the appropriate quick help
on it.
 opens the dialog for printout. (Note that a histogram
image can be saved in the PostScript format by using print to file
option.)
opens the dialog for printout. (Note that a histogram
image can be saved in the PostScript format by using print to file
option.)
 saves a histogram image as a PDF file
 saves a histogram table as a Comma Separated Values (CSV)
Microsoft Excel file. Note that there might be a problem in reading
CSV format files due to Regional Options and Microsoft Excel International
Options (see Appendix C. Platform
Notes).
saves a histogram table as a Comma Separated Values (CSV)
Microsoft Excel file. Note that there might be a problem in reading
CSV format files due to Regional Options and Microsoft Excel International
Options (see Appendix C. Platform
Notes).